
Sample Profile Graph
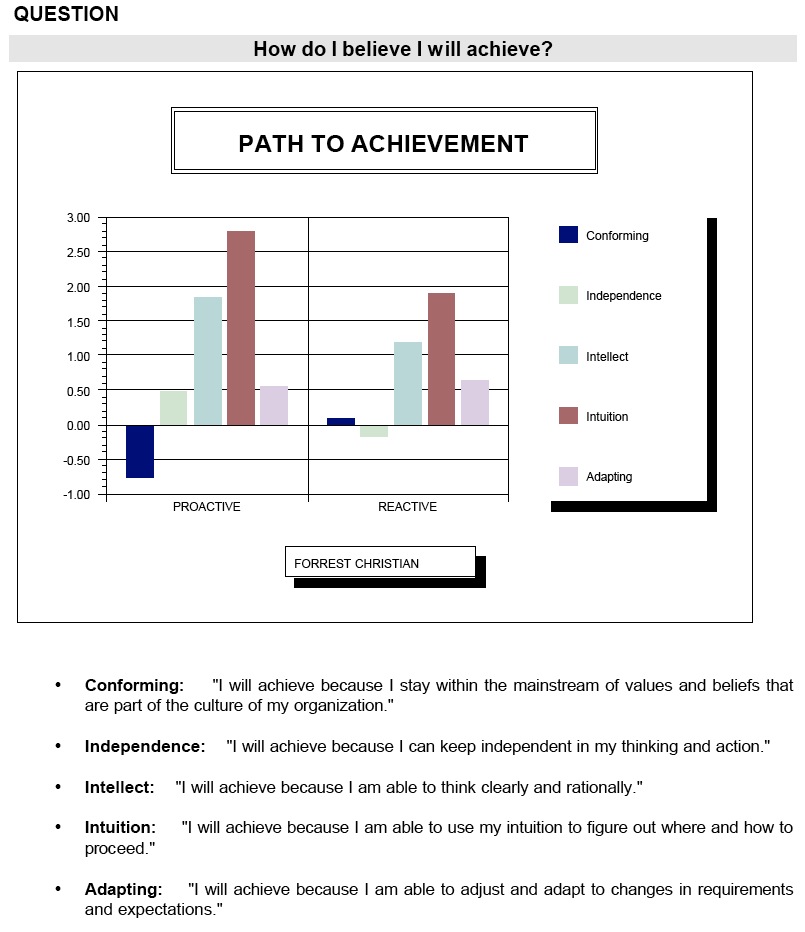
There are two sets of results: one when I am relaxed and one when I am stressed. On the left are my proactive responses. That means how I respond when I am relaxed, or how I would like to think I am. The right are my reactive responses, or what I am like under stress.
The big bar labeled Intuition shows how much more than others I rely on intuiting solutions to problems. That big bar for Intuition means that when relaxed and when under stress, I will believe that I achieve through gut instinct, if you will. My intuition tells me where to go to solve so that I can achieve. The bar is big: I am almost 3 standard deviations away from the norm on my preference. This means that it is a massive preference. Everyone around me can see that I do this. Not only that, but because it is higher than 2, I may need to compensate for it on my team.
I was amazed at what came out my Human Patterns. Even taking this opportunity to look at it again right now, as I'm writing this, I can see new things that I need to correct in my life. Not to change my personality or preferences, but to stop doing things that are unnatural for me.
See sample graph from Forrest's Human Patterns profile

